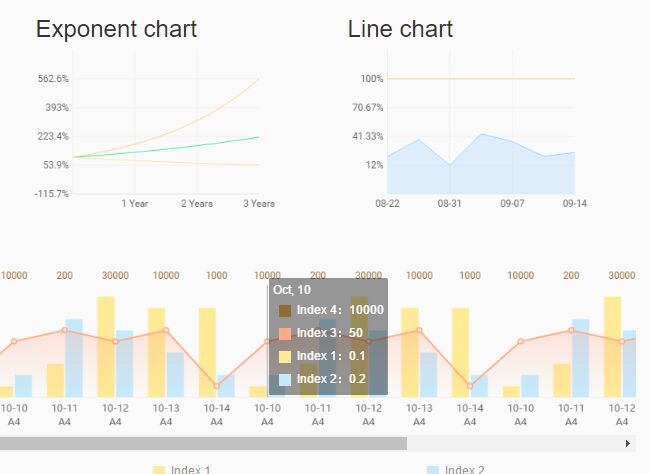
This time I will share jQuery Plugin and tutorial about Animated Feature-rich Chart / Graphic Plugin With jQuery – charts, hope it will help you in programming stack.
A robust jQuery/HTML5 chart / graph plugin which helps you draw a wide variety of animated, customizable graphics and charts using HTML5 canvas API.
Chart types included:
- Pie chart
- Bar chart
- Radar chart
- Score Meter
- Scales chart
- Exponent chart
- Scatter Chart
- Scales chart
How to use it:
1. Load the jQuery charts plugin and other required resources in the html document.
1 |
<script src="//code.jquery.com/jquery-3.1.1.min.js"></script> |
2 |
<script src="dist/utils.js"></script> |
3 |
<script src="dist/jquery.charts.js"></script> |
2. Create an HTML5 canvas element on which you want to draw the charts & graphics.
1 |
<canvas id="demo"></canvas> |
3. Create custom shapes:
1 |
drawCircle(context, x, y, r, s, e, style, type, width): |
2 |
drawSector(context, x, y, r, s, e, style, type, width): |
3 |
drawArc(context, x, y, r, s, e, style, width): |
4 |
drawLine(context, points, style, width) |
5 |
drawPolygon(context, points, style, type, width) |
6 |
drawText(context, text, x, y, color, fontSize, fontFamily, align, vertical) |
7 |
drawRoundRect(context, x, y, w, h, r, style, type, width) |
4. Create a line chart on the canvas element.
01 |
var canvas_line = $('#demo'); |
07 |
data: [[0.21,0.38,0.12,0.44,0.36,0.21,0.25],[1,1,1,1,1,1,1]], |
08 |
colors: ["#99d1fd", "#fed27c"], |
10 |
background: 'transparent', |
17 |
start: function (options) { |
19 |
drawing: function (cValue, tValue, options) { |
21 |
end: function (options) { |
25 |
x:["08-22","08-31","09-07","09-14"], |
5. Create a line + bar chart on the canvas element.
001 |
var canvas_mix = $('#canvas_mix'); |
017 |
[0.1, 0.2], [0.3, 1], [0.9, 0.6], [0.8, 0.4], [0.8, 0.2], |
018 |
[0.1, 0.2], [0.3, 0.7], [0.9, 0.6], [0.8, 0.4], [0.8, 0.2], |
019 |
[0.1, 0.2], [0.3, 0.7], [0.9, 0.6], [0.8, 0.4], [0.8, 0.2], |
020 |
[0.1, 0.2], [0.3, 0.7], [0.9, 0.6], [0.8, 0.4], [0.8, 0.2], |
021 |
[0.1, 0.2], [0.3, 0.7], [0.9, 0.6], [0.8, 0.4], [0.8, 0.2], |
022 |
[0.1, 0.2], [0.3, 0.7], [0.9, 0.6], [0.8, 0.4], [0.8, 0.2] |
025 |
'Oct, 10', 'Oct, 11', 'Oct, 12', 'Oct, 13', 'Oct, 14', |
026 |
'Oct, 10', 'Oct, 11', 'Oct, 12', 'Oct, 13', 'Oct, 14', |
027 |
'Oct, 10', 'Oct, 11', 'Oct, 12', 'Oct, 13', 'Oct, 14', |
028 |
'Oct, 10', 'Oct, 11', 'Oct, 12', 'Oct, 13', 'Oct, 14', |
029 |
'Oct, 10', 'Oct, 11', 'Oct, 12', 'Oct, 13', 'Oct, 14', |
030 |
'Oct, 10', 'Oct, 11', 'Oct, 12', 'Oct, 13', 'Oct, 14' |
033 |
'10000', '200', '30000', '10000', '1000', |
034 |
'10000', '200', '30000', '10000', |


