This time I will share jQuery Plugin and tutorial about Simple Plain Column Chart Generator In jQuery – bar-chart.js, hope it will help you in programming stack.
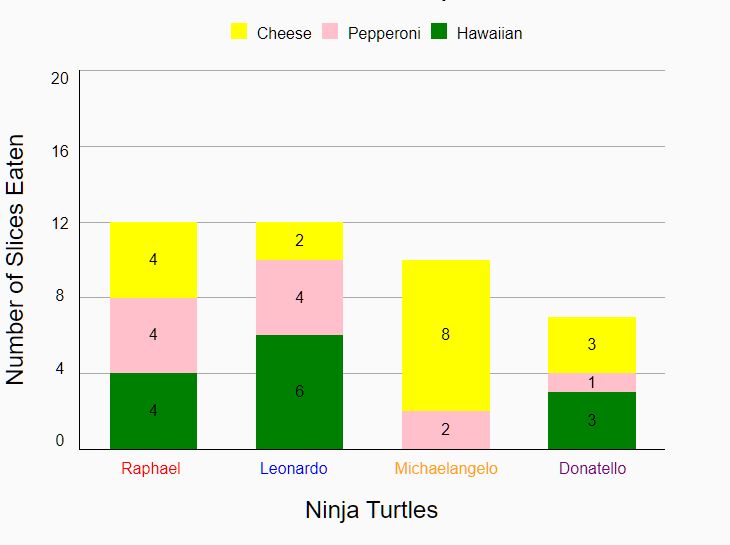
A lightweight yet customizable jQuery bar chart plugin to generate a responsive, vertical, standard or stacked column chart using plain HTML, CSS, JavaScript.
More Features:
- Custom legend.
- Custom x- and y-axis lables & text.
- Custom chart size & title.
- Renders data from JS array.
How to use it:
1. Create a container in which you’d like to render the column chart.
1 |
<div id="testDiv"></div> |
2. Load the main stylesheet in the head of the document.
1 |
<link rel="stylesheet" href="main.css" /> |
3. Load the JavaScript after the latest jQuery library.
1 |
<script src="/path/to/cdn/jquery.min.js"></script> |
2 |
<script src="/path/to/bar-chart.js"></script> |
4. Override the default chart data. For a standard column chart, use multiple arrays with 1 value in each array.
04 |
dataValues: [[4, 4, 4], [2, 4, 6], [8, 2, 0], [3, 1, 3]], |
07 |
legend: ["Cheese", "Pepperoni", "Hawaiian"], |
10 |
legendColors: ["yellow", "pink", "green"], |
13 |
barLabels: ["Raphael", "Leonardo", "Michaelangelo", "Donatello"], |
16 |
labelColors: ["red", "blue", "orange", "purple"] |
4. Customize the column chart by overriding the default options as displayed below.
10 |
chartTitle: "Pizza Consumption", |
13 |
chartTitleColor: "black", |
16 |
chartTitleFontSize: "2rem", |
19 |
yAxisTitle: "Number of Slices Eaten", |
22 |
xAxisTitle: "Ninja Turtles", |
25 |
barValuePosition: "center", |
5. Override the default jQuery selector of the chart container.
1 |
let element = "#testDiv"; |
This awesome jQuery plugin is developed by dexterchan94. For more Advanced Usages, please check the demo page or visit the official website.


